- Browse Categories
- YQFH Drone
- DJI Drone
- Other Drone
- Drone Payloads
- Robot
- Pipeline Detection Instrument
- 3D Laser Scanner
- Industrial Measurement Devices
- Weather Station Series
- Optical Survey Instruments
- GNSS RTK & CORS System
- BDS System Products
- Visual Displacement Monitoring System
- UWB Indoor Positioning System
- Hydrology Products
- Others
- Spectrometer
- Wet Blast Machine
- SDI Soil Tester
- Pengjin Smart Flying Drone Patrol and Inspection System
- Supercomputing
- Module
- Viscometer
- Electric Hygro-thermograph
- Echo Sounder
- Processing Software
- Keson Measuring Tools
EKKO_Project™ GPR Software
- Brand name: Sensors and software
- Model name: EKKO_Project™ GPR software
- Origin: Canada
- Warranty period: 1 year
- Support Express: Shipping, Airmail
EKKO_Project™ GPR Software
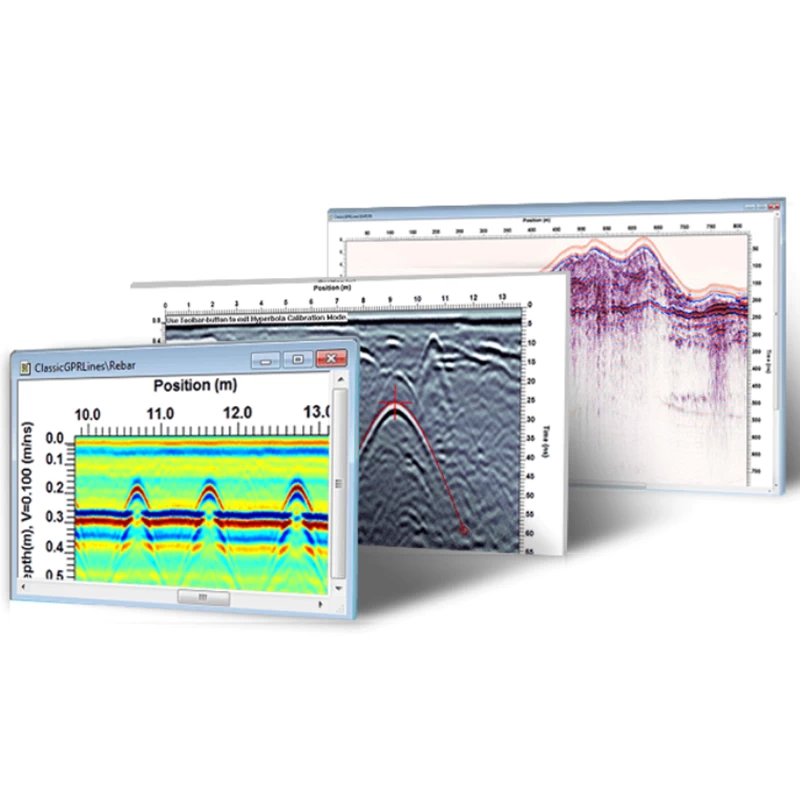
EKKO_Project is a comprehensive software solution for managing, displaying, processing and interpreting GPR data.
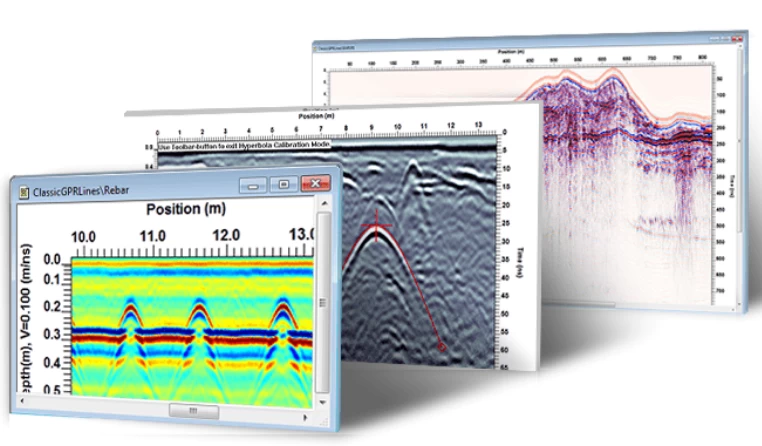
EKKO_Project™ Visualize ● Understand ● Report
- EKKO_Project makes powerful GPR data analysis easy.
- EKKO_Project reduces the time spent organizing, editing and processing GPR data, and allows you to interpret and extract valuable insights.
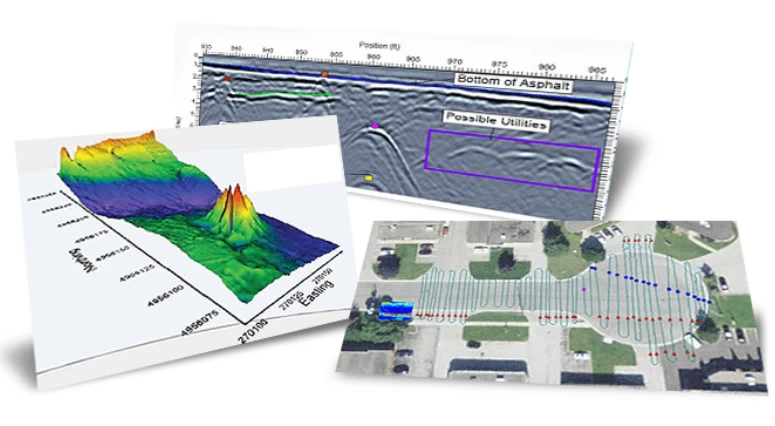
- Intuitive Data Visualization Tools allow you to view and understand data from a variety of perspectives, and quickly and easily create impressive reports and share your findings.
- EKKO_Project is a must for anyone using sensors and software GPR systems.
Our software bundles are built on the EKKO_Project™ Core and consist of powerful modules that extend data analysis and visualization capabilities.
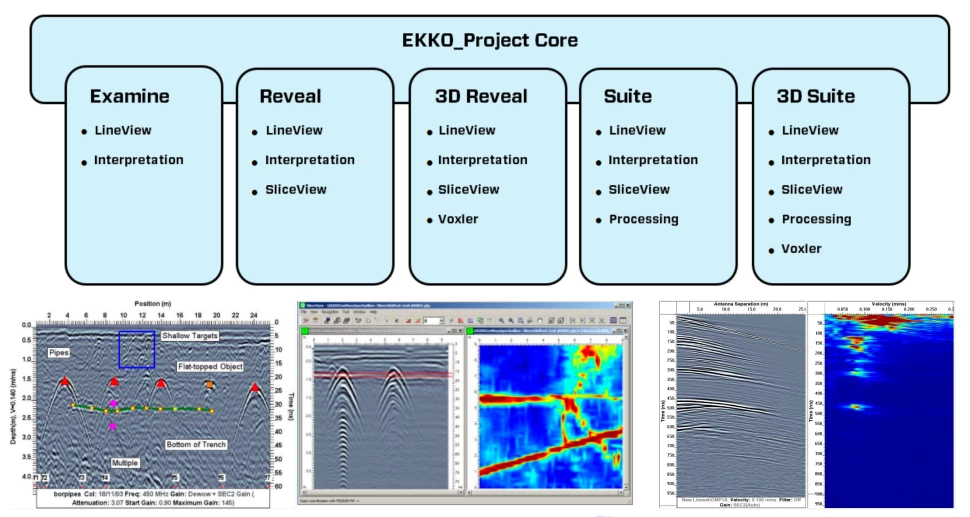
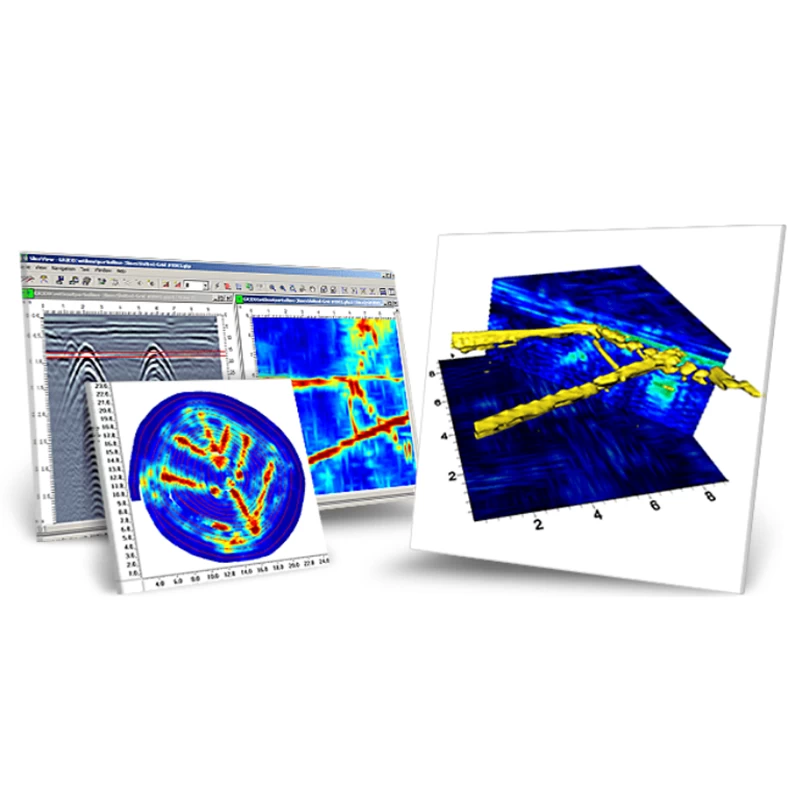
3D Boxler
Voxler module: Displays grid data as a 3D volume and reveals targets
Included in 3D Reveal and 3D Suite bundles
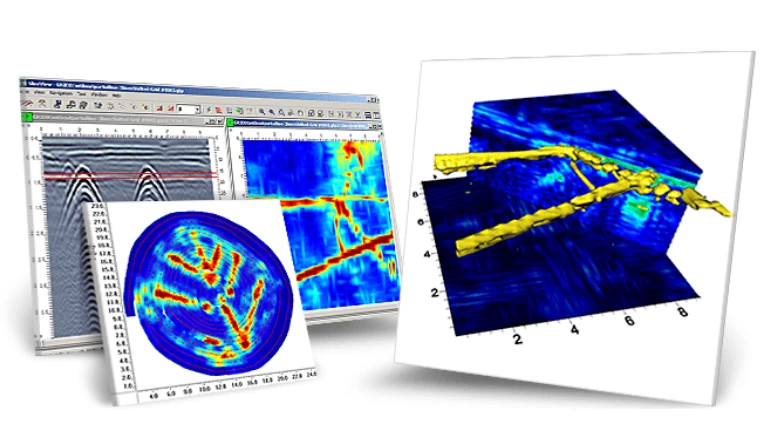
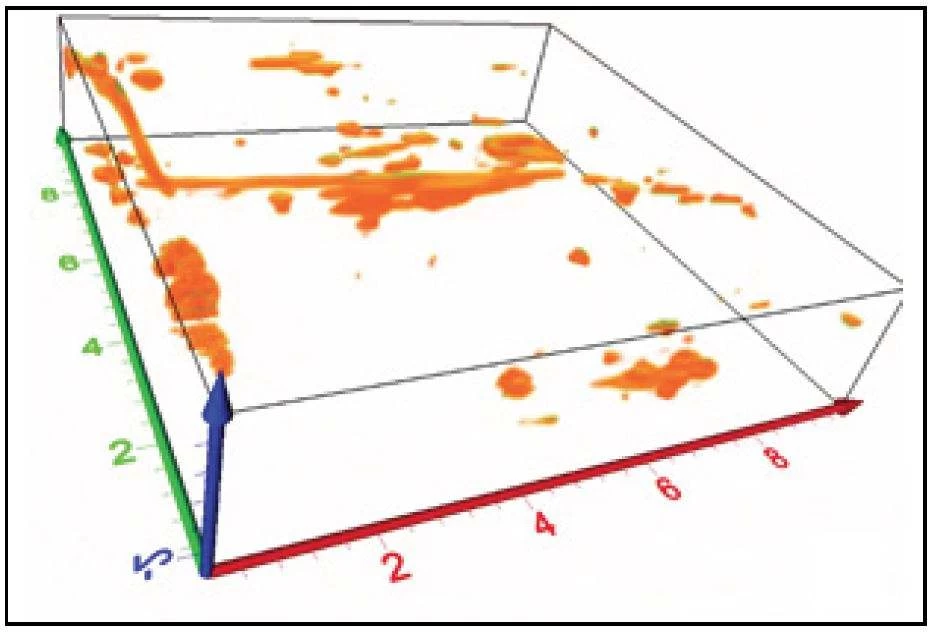
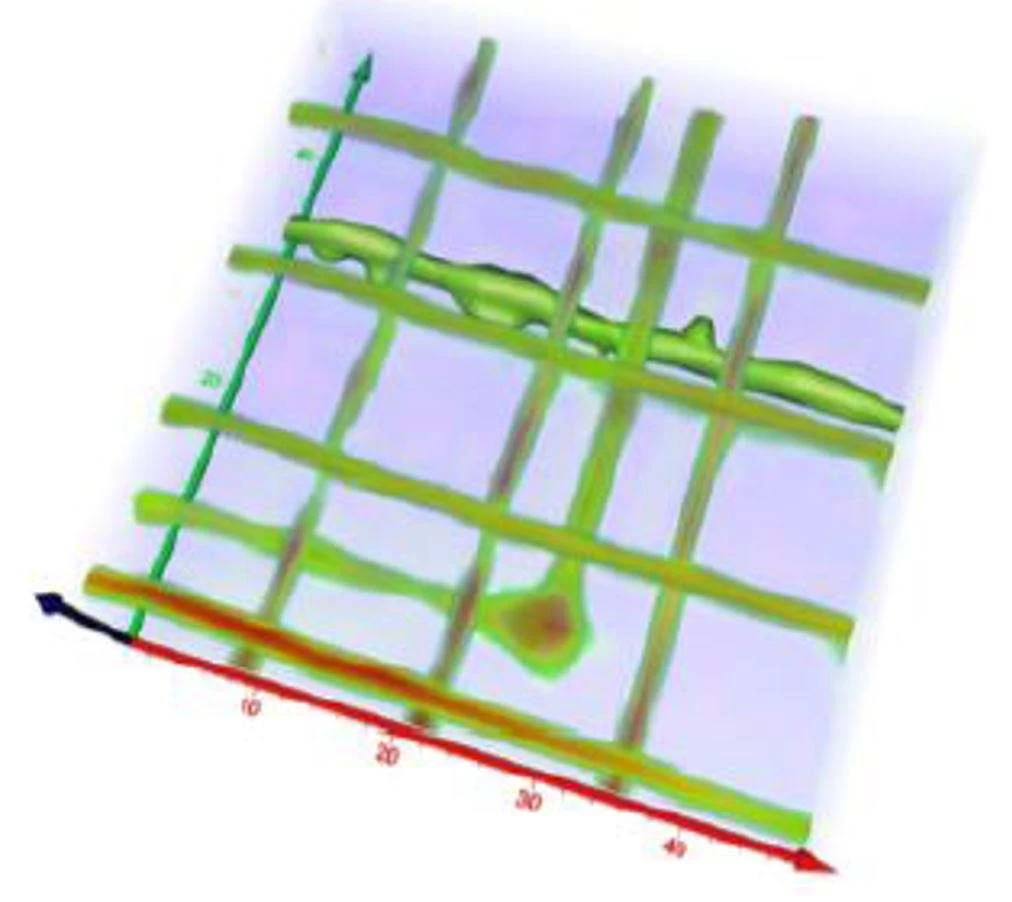
View grid data as a 3D volume to reveal targets
|
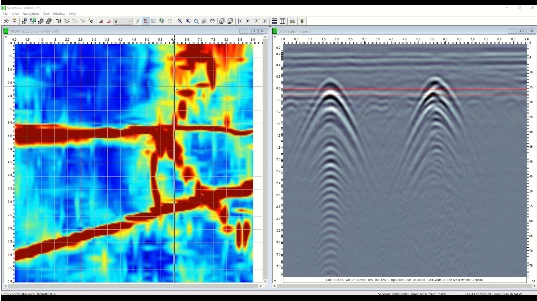
GPR grid data plotted in 3D allows you to visualize the entire data volume in a single view, discover areas of interest, identify anomalies accurately, and identify patterns and trends. When GPR data is launched from the SliceView module, it opens automatically in the Voxler program with preset parameters. |
|
|
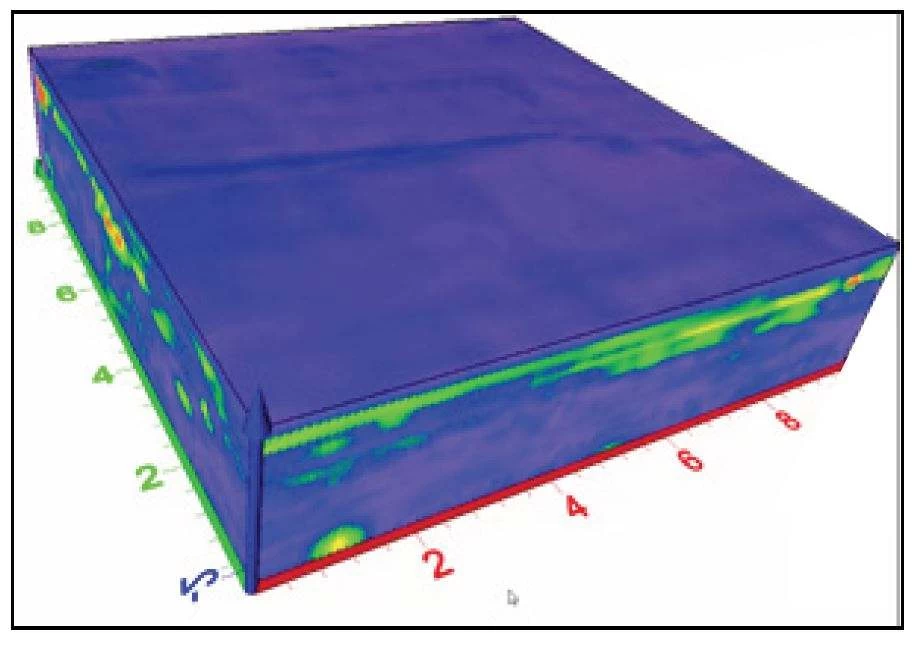
Isovalue surface In the plot, all data is displayed with the same amplitude value. Powerful 3D images for understanding GPR data. |
|
|
|
|
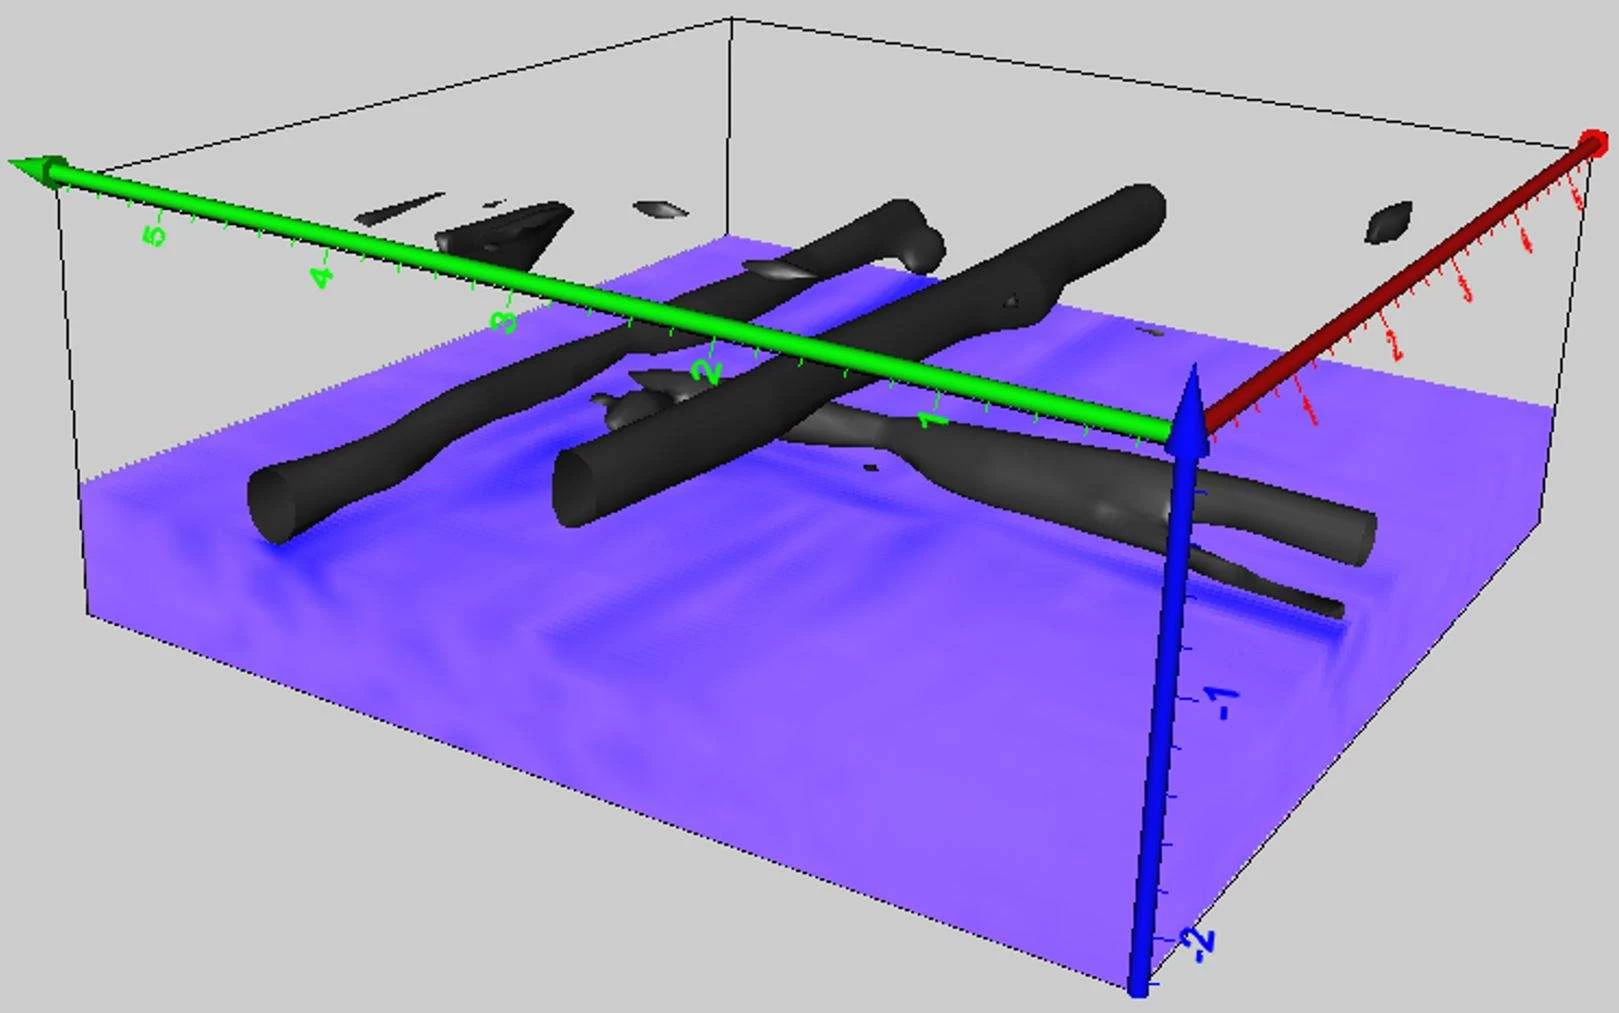
Variable Opacity The plot displays the strongest reflectors in the grid (often a utility or target). A weak signal can be translucent or transparent. |
|
|
|
|
Quickly create insightful visualizations for multiple applications
|
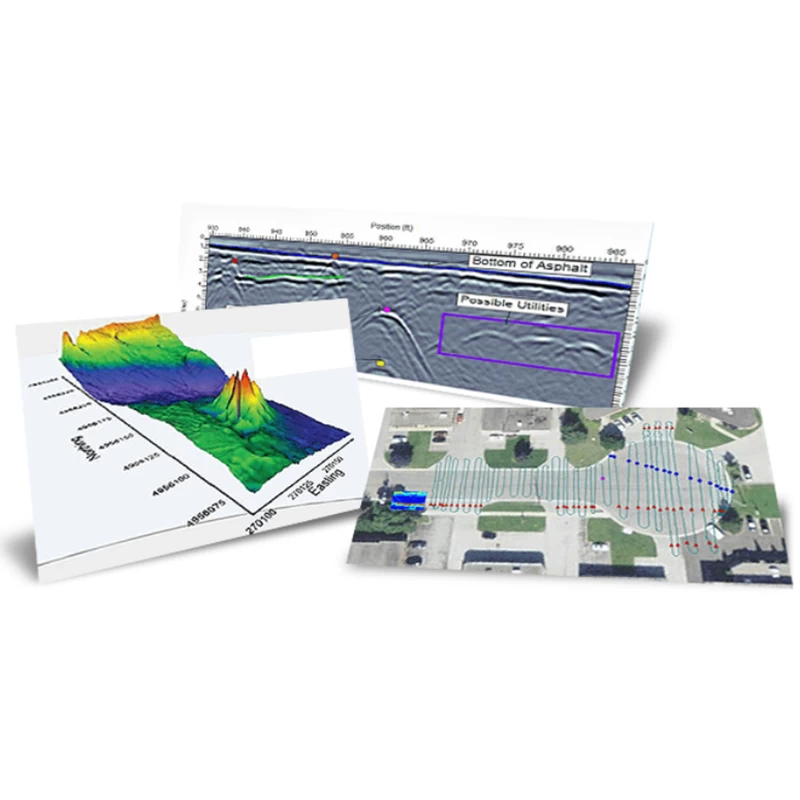
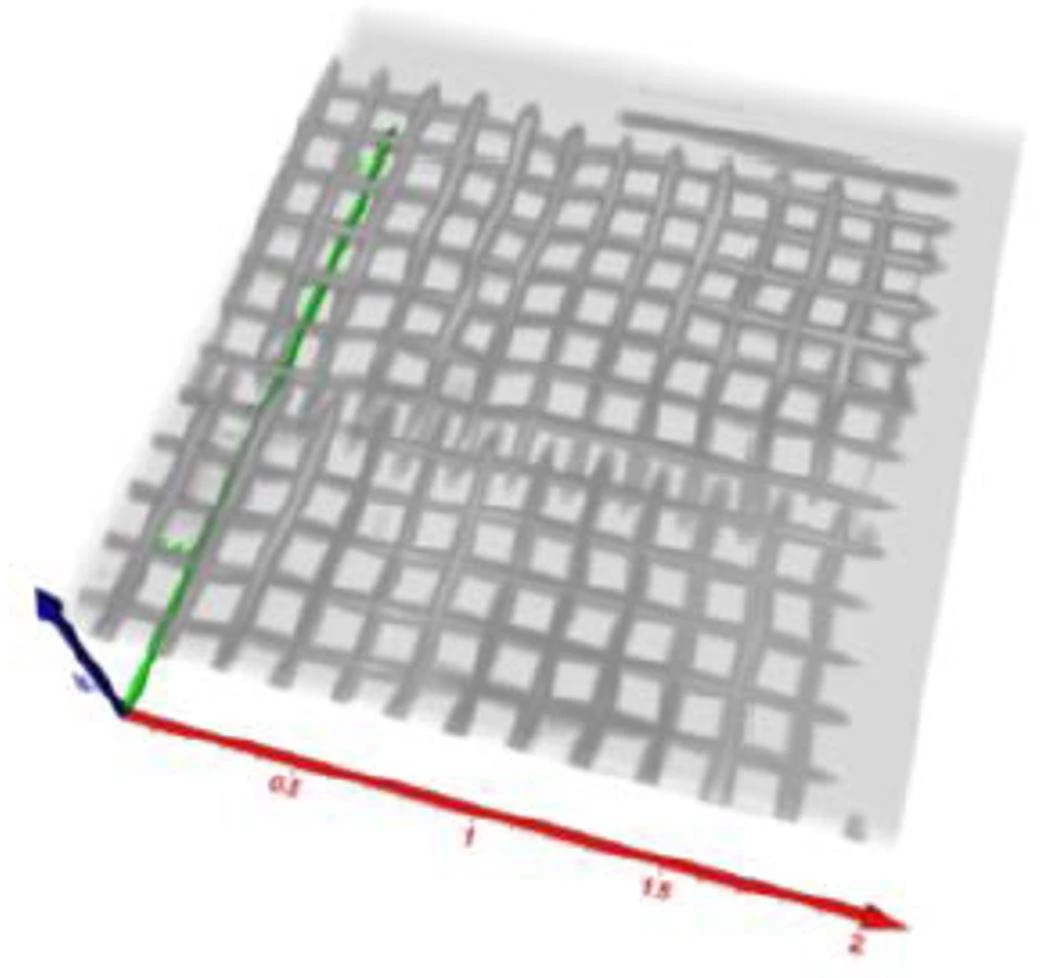
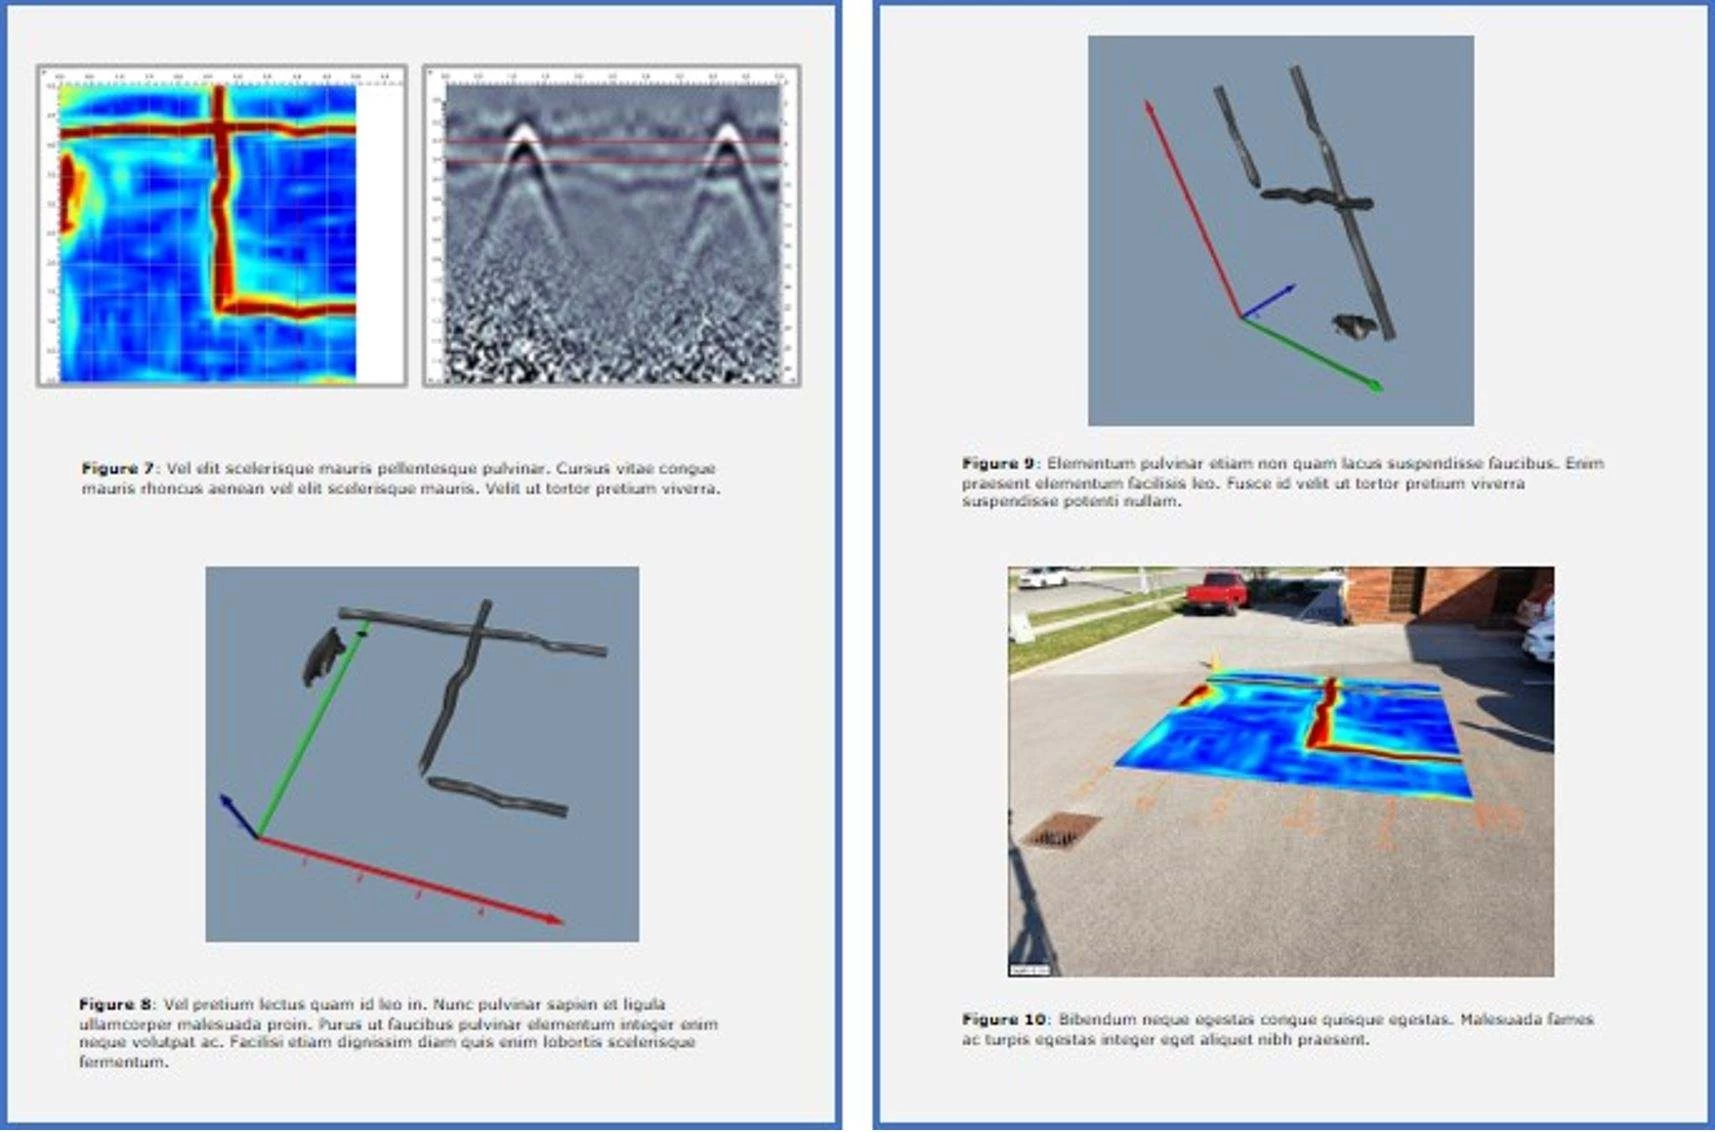
Specific data: 3D plots are particularly useful for grid scans collected on concrete. These are used to reveal embedded structural elements of any depth. |
|
|
|
|
|
A 3D plot of concrete is combined with a PCD (power cable detector) to reveal the location of the conduit in which current flows within the concrete. |
|
|
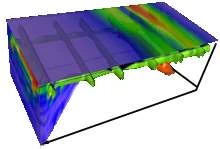
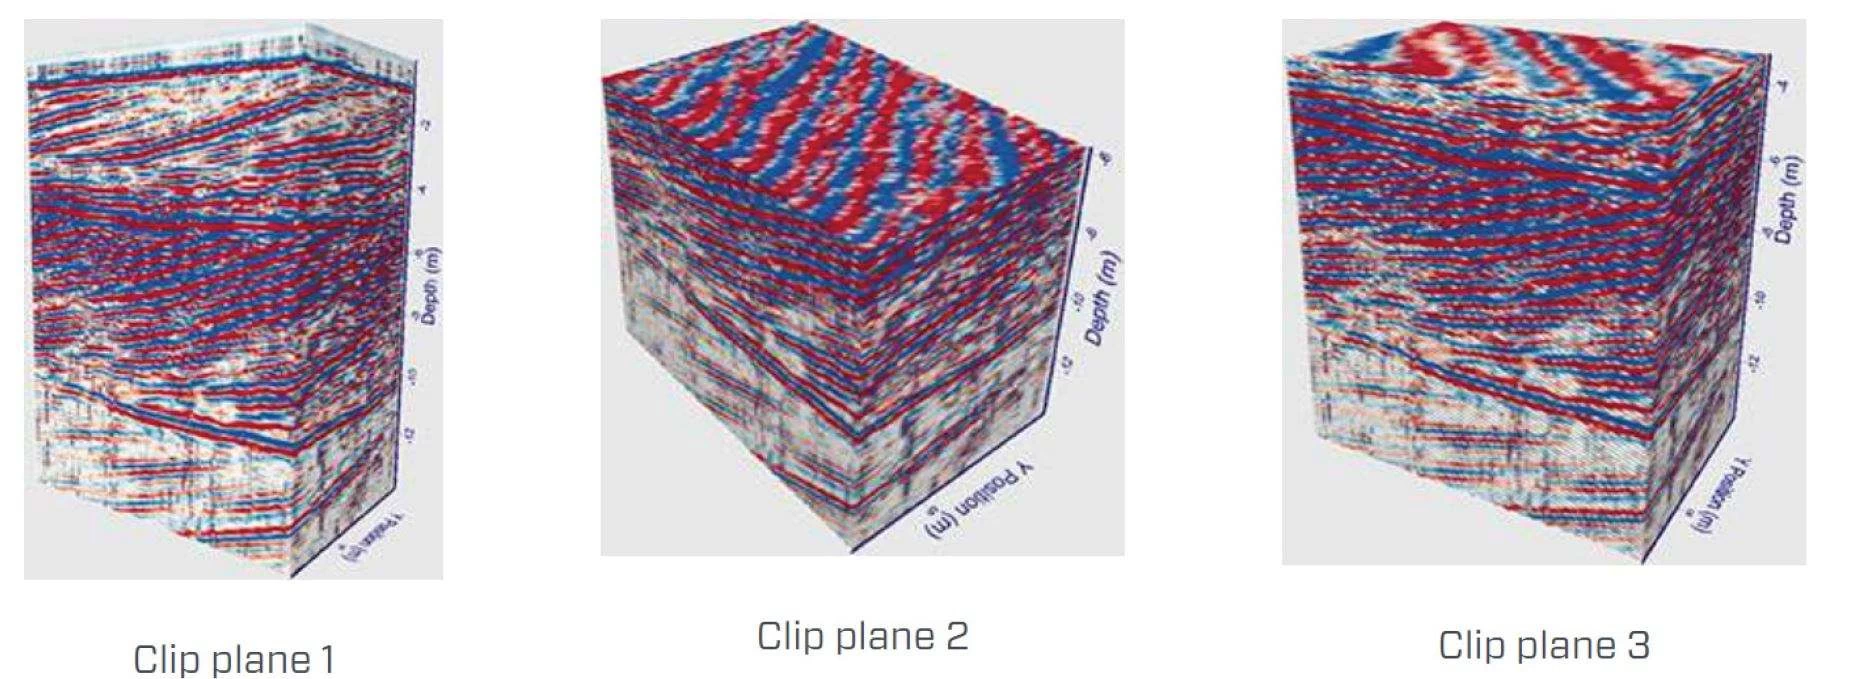
Geological data: Plotting large amounts of geological data and using clip planes will display sedimentary structures, such as the anterior layer, in 3D. |
|
Tell the results
|
Highlight important information and communicate it easily to your customers. You can export images in high quality formats such as PDF or TIFF, or share your work with PNG or SVG. Better yet, Voxler's built-in video tool can be used to provide a dynamic view of your data. |
|
If you are interested in this product, please feel free to contact us.

- Other Products